Read the graph without reading tea leaves
Choose a period and understand what is measured.
Switch a chart metric and period, then read its label.
In this lesson 3 steps + optional extras
Open Analytics and choose a period. The current calendar period includes today, so today’s figures may still be incomplete.
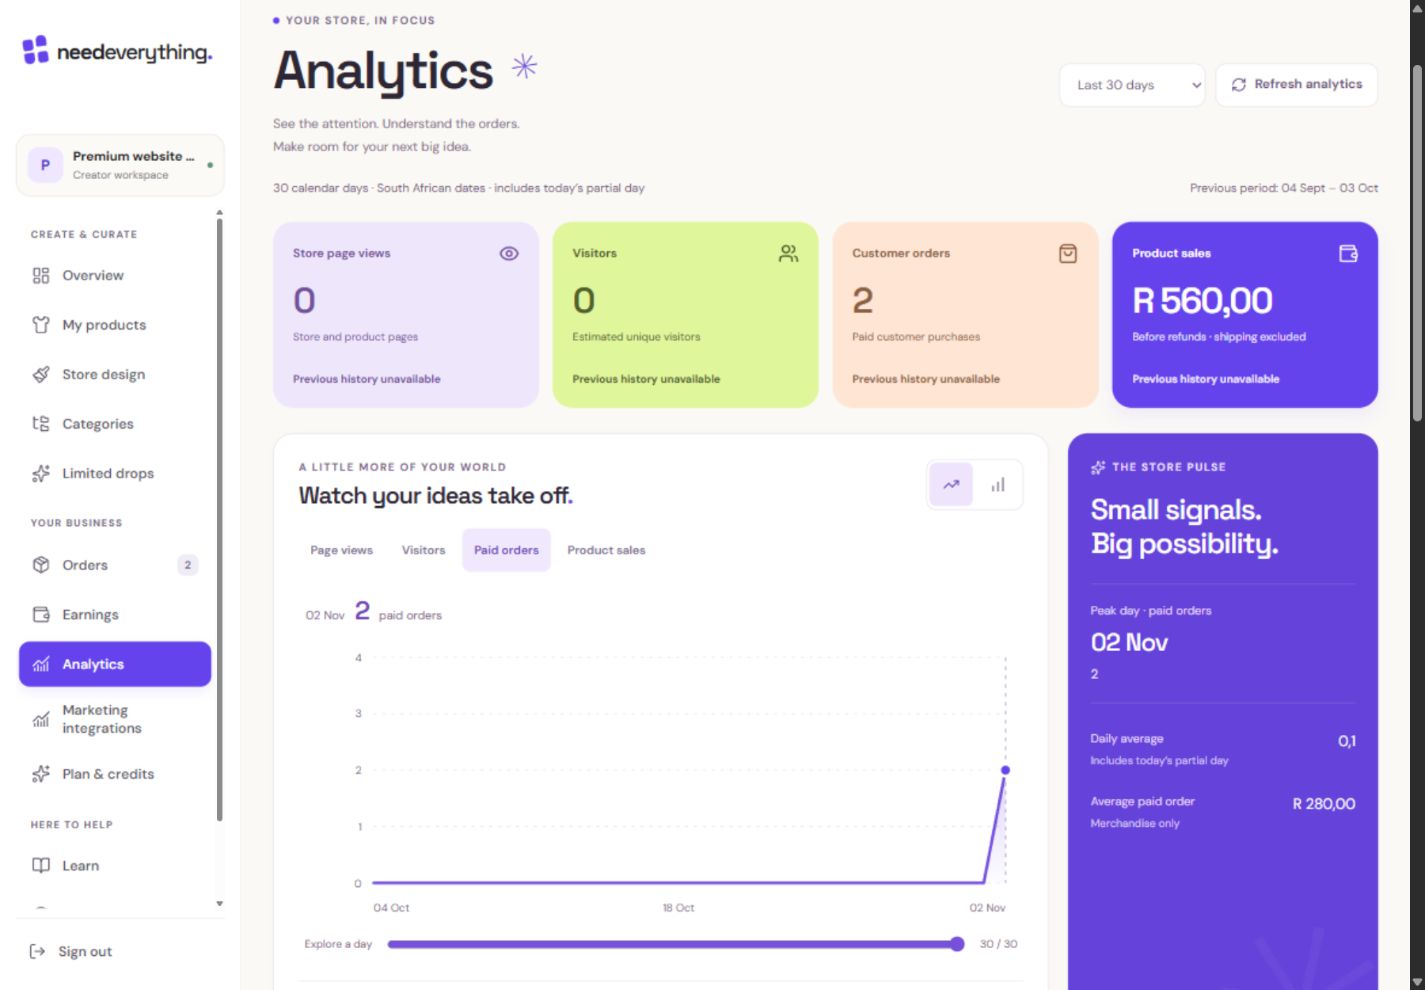
- 1Switch the measure. Orders, visitors and views mean different things.
- 2Choose the chart style that helps you read the pattern.
- 3Read an exact day. The example store has two simulated paid orders.
What you should seeThe selected calendar period and unfinished current day are identified.
Switch between page views, paid orders and product sales. These are different measures, not interchangeable names for success.
What you should seeThe chart label changes with the selected metric.
Compare with the preceding equal-length calendar period. An increase from zero should not be read as a meaningful percentage growth rate.
What you should seeThe comparison uses a preceding period of the same length without a misleading zero-based percentage.
Go further 2 optional topics
You have the core task. Explore these extra tools whenever you need them.
Look for unavailable or partial-history messages. Traffic retention and the start of measurement limit what a comparison can say.
What you should seeUnavailable history is distinguished from zero activity.
Visitors and views do not equal buyers. Use the counts as clues about what to inspect, not proof that one design change caused a sale.
What you should seeViews and visitors are presented separately from confirmed buyers.
Give it a try.
Switch a chart metric and period, then read its label.
Open Analytics Opens separately. Paid and destructive actions are never required to complete a lesson.Your selected period includes today. What should you remember?
Optional. No grades, no locked lessons.Ready to mark this one complete?
You choose when you have learned enough. No quiz score or business action is required.
Loading progress…
Sign in to save progress across devices